To help you better understand the information displayed in the Live Scanner table, here are a few examples:
-
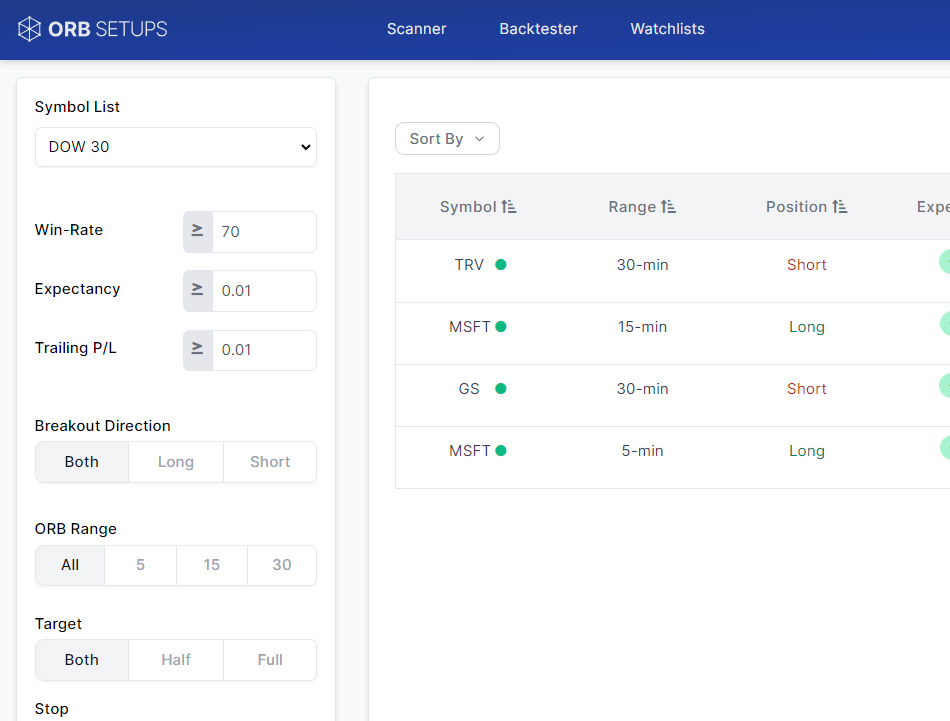
Example 1 If you set your filters to only display trades with a win-rate of over 50%, the table will only show symbols that meet this criteria. By default, the win-rate filter is set to 75%. If you are scanning in a small group of stocks (ie. DOW 30) and don’t see any triggers, your filters may be too tight for the current volatility. One way to widen the funnel is by decreasing the win-rate requirement – even something as simple as 70% will usually lead to some more setups.
-
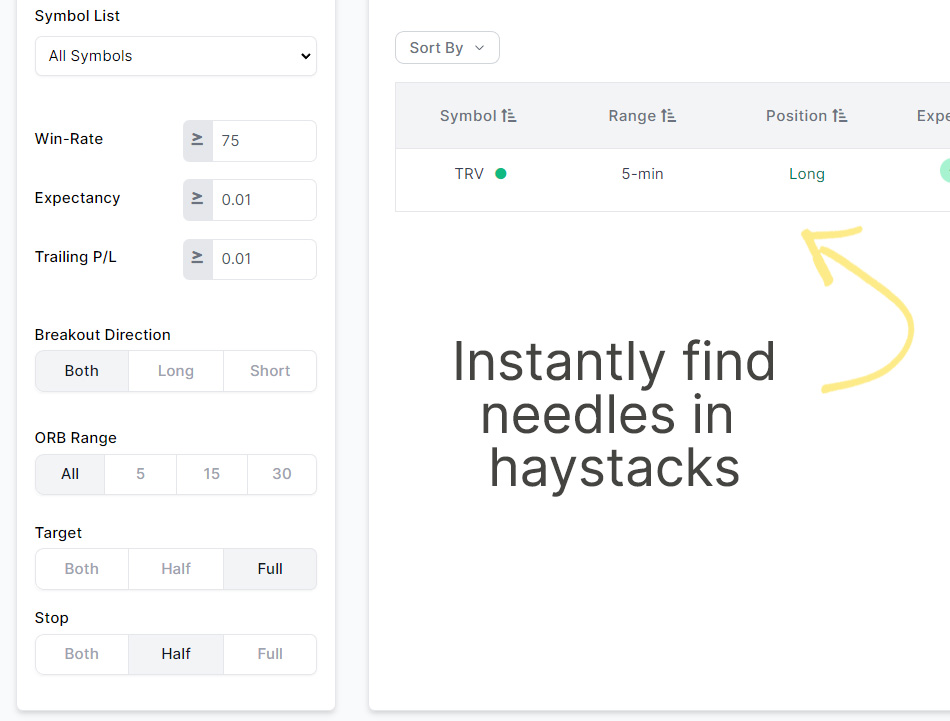
Example 2 If you set your stop to a half-range, but your target to a full-range, the Live Scanner will automatically show you trades with a 1 Risk – 2 Reward ratio, that also meet your win-rate and P/L criteria. This means you can easily narrow down to the handful of uniquely skewed R/R opportunities that set up everyday, without needing to go digging for them.
-
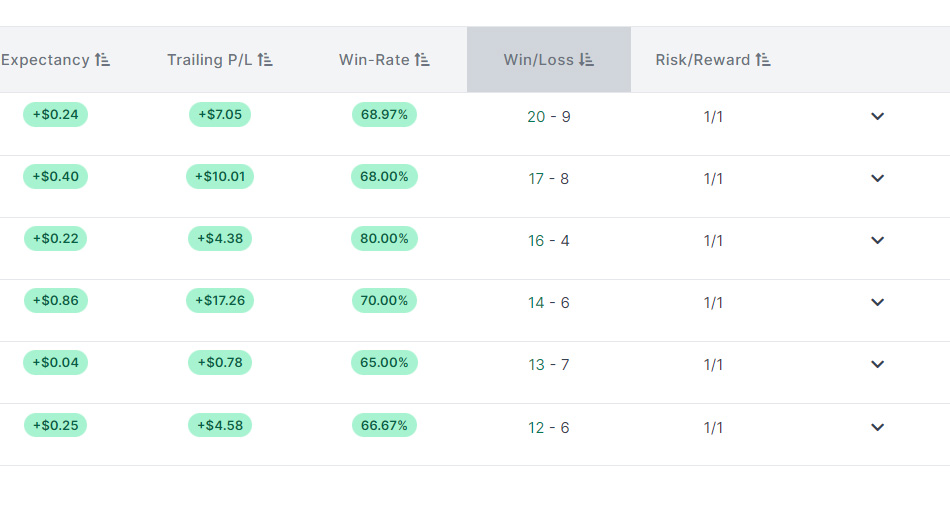
Example 3 If you want to optimize for the number of data points used in a backtest, you can sort by the Win-Loss column. You can then easily find trades with consistently high win-rates and trade expectancies, with a larger data set.